
Open Your Business in Montclair NJ
October 29, 2018
Strong Montclair Home Sales in November, Now What?
December 15, 2018
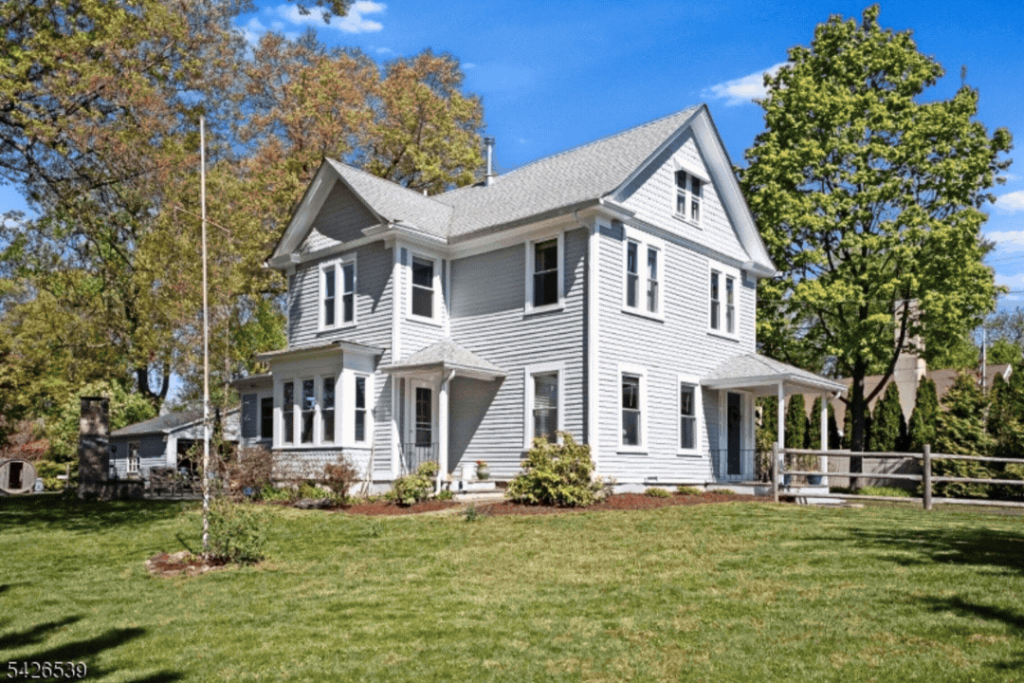
176 South Mountain Avenue, Montclair, NJ
Montclair NJ Homes for Sale
Recap by Stanton, October 2018
Top Heavy Local Market in Montclair
The Montclair real estate market got ‘top heavy’ in October as homes under $800,000 continued to sell, while houses over $1 million struggled to find buyers.
The average price of active listings in October was at a ten year high of $877K versus an average price of $744K in October last year.
The drop in sale price versus original list price to 99% from 101% last October, and 103% in September, offers further evidence of some softness in the market.
That being said, 62 new listings and 163 active listings in October spurred solid buyer traffic, and 44 houses went under contract.
Typically, available listings will dwindle over the next few months due to current inventory being sold, properties being withdrawn, and a lack of new listings. Last year, active homes for sale in Montclair were 167 in October, 116 in November, 94 in December, and 88 in January.
It can be a great time for buyers to target good values. Specifically consider homes that have been on the market for a while with the prospect of spending more time on market, especially “ugly duckling” houses in need of some cosmetics, but are fundamentally good houses.
Let me know if you would like to be apprised of any buying opportunities.
Best, Rich
(917) 536-8257
PS – Check my previous article for information about September 2018 Montclair NJ Area Real Estate Market results.


